


Global Gender Biases Infographic
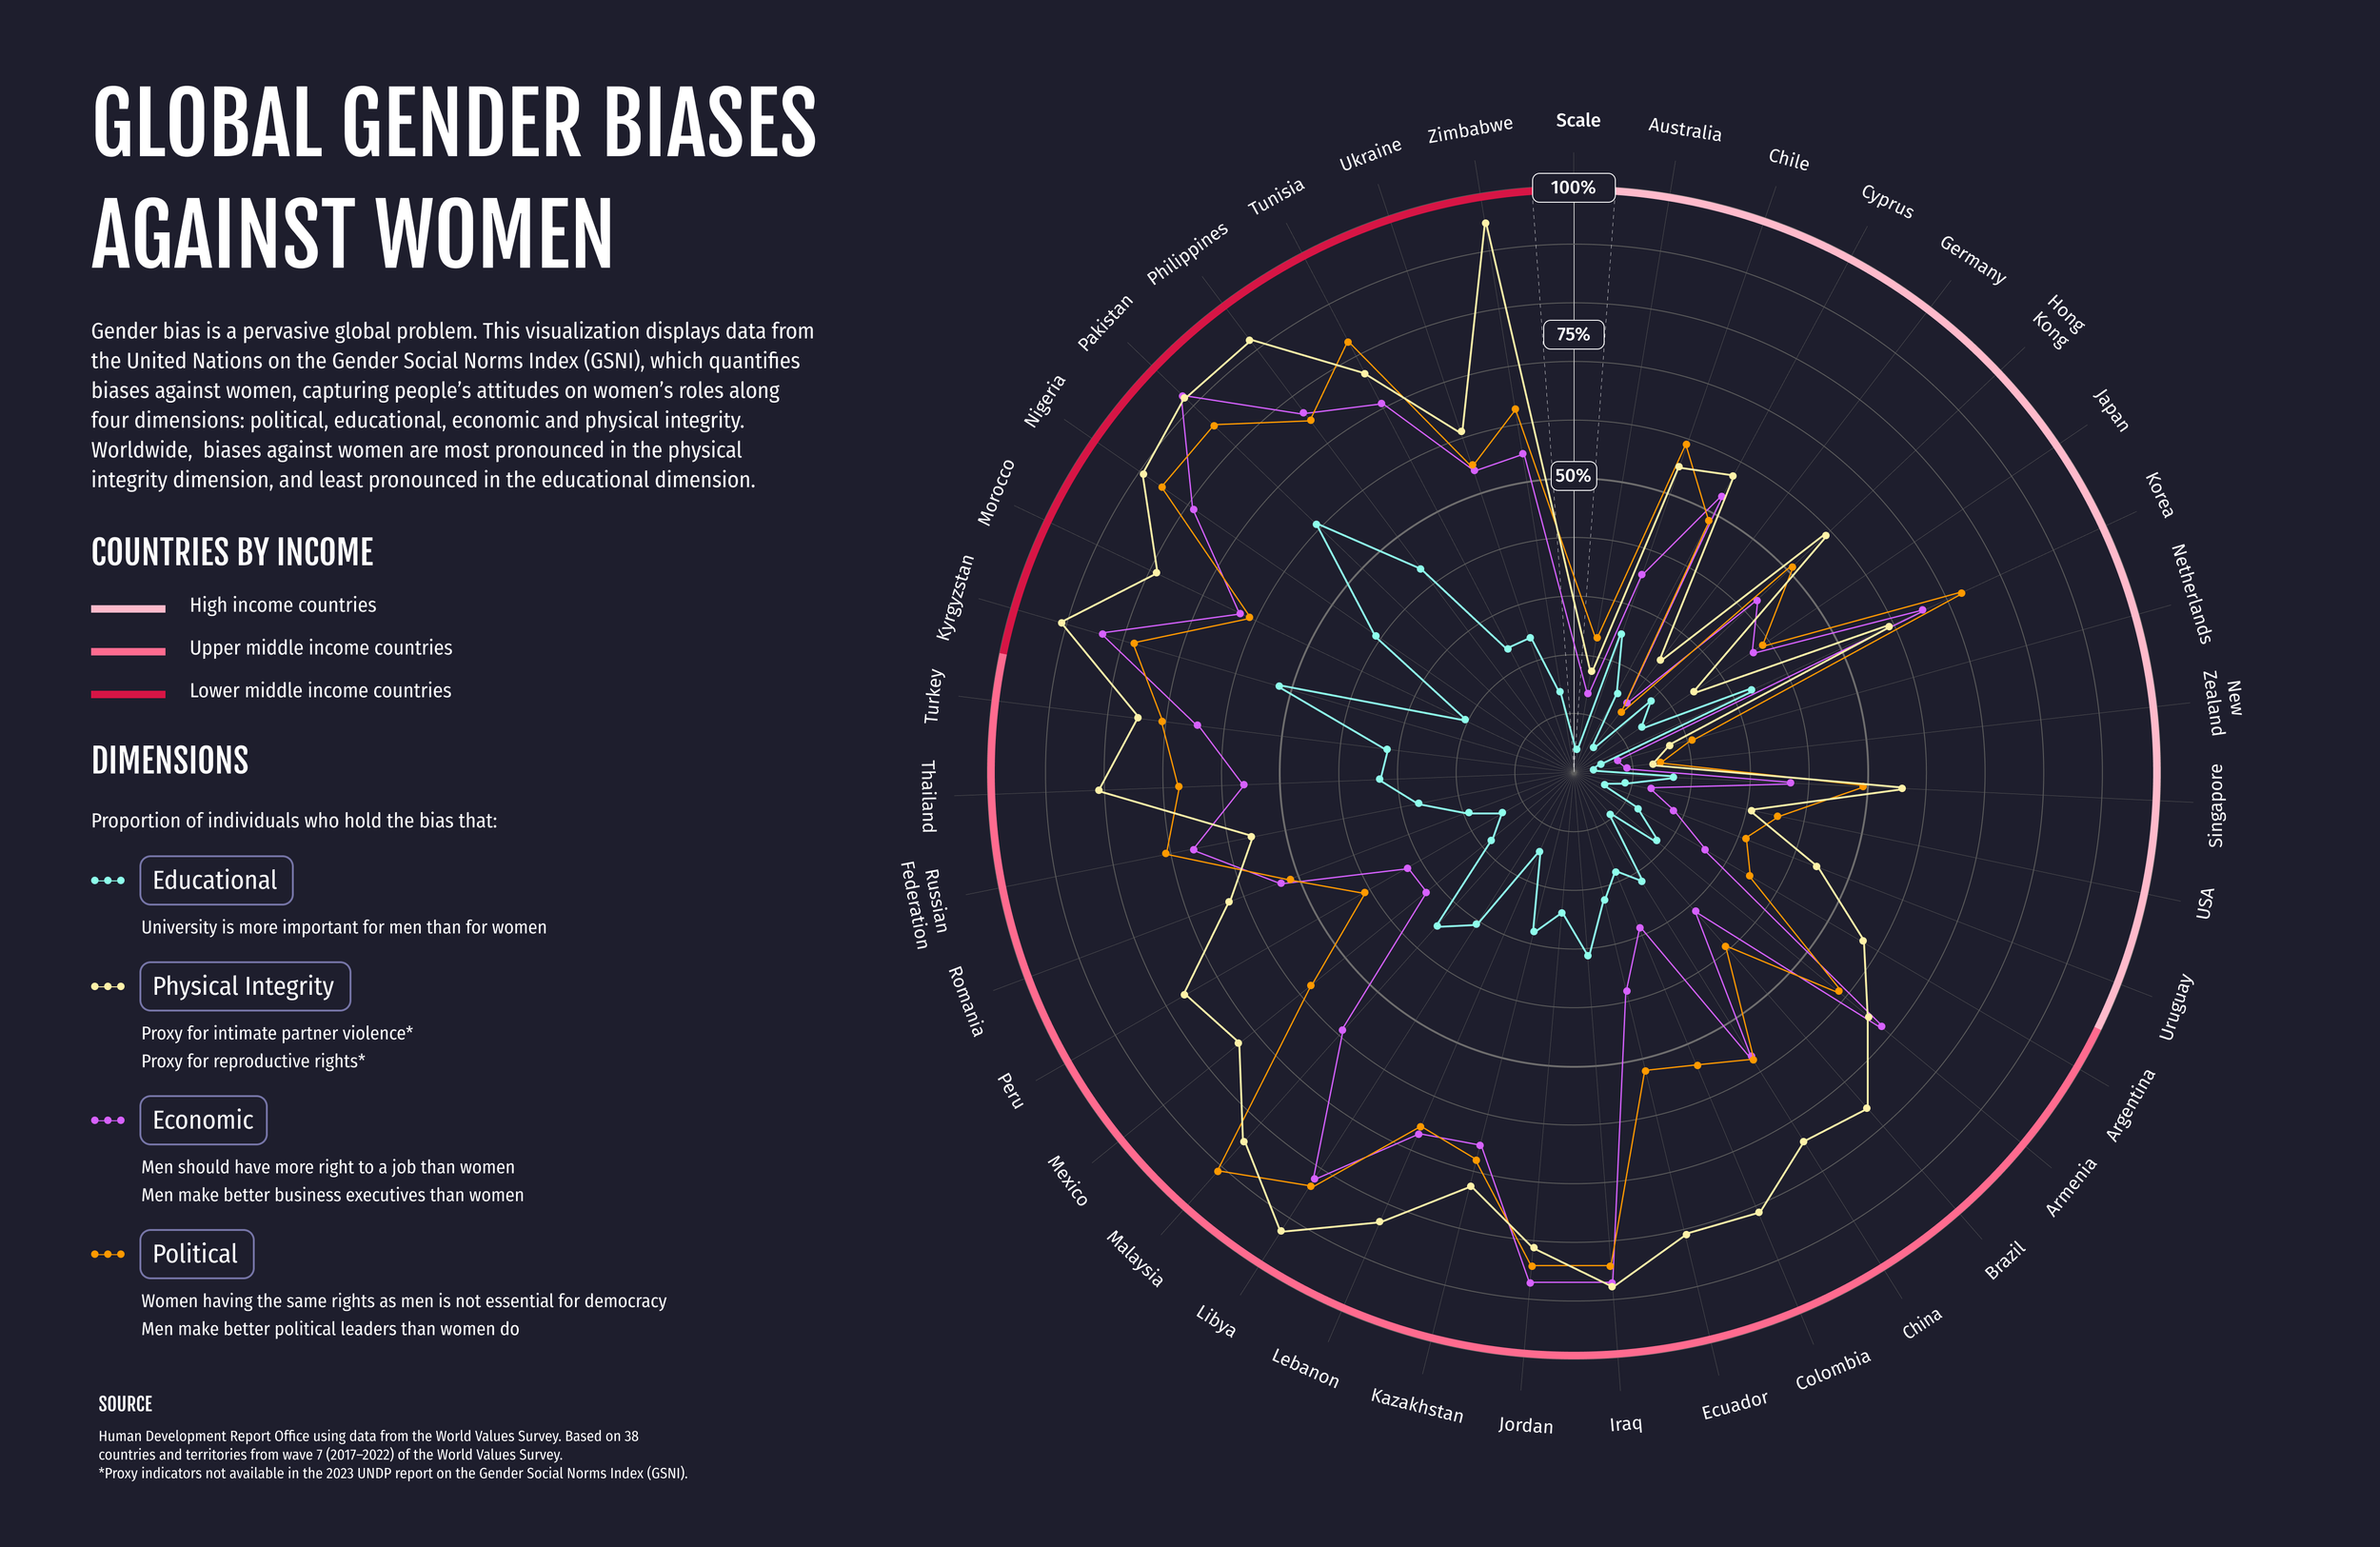
Visualizing data from the UNDP’s Gender Social Norms Index (2017-2022), which captures people’s attitudes on women’s roles along four key dimensions: political, educational, economic and physical integrity.
Moving towards gender equality
Biased gender social norms are a critical barrier to achieving gender equality. The Gender Social Norms Index (GSNI) quantifies political, educational, economic and physical integrity biases against women. The index, covering 85 percent of the global population, reveals that gender biases are pronounced in both low and high Human Development Index (HDI) countries—they hold across regions, income, level of development and cultures.
In 2023, I came across this report from the UNDP and sought to visualize 2017-2022 GSNI data: 2023 Gender Social Norms Index (GSNI) | Human Development Reports (undp.org)
Date completed
August 2023
Skillsets
Figma, Data visualization, Data analysis, Excel, presentation
001: Data Exploration
Drawing out key findings and identifying the narrative I wanted to convey
Since I wanted to visualize the most recently released data, I looked at the 2017-2022 dataset from 38 countries, in the UNDP’s seventh wave of data.
During initial data exploration, I found out that:
Gender biases are most pronounced in the physical integrity dimension and least pronounced in the educational dimension.
High income countries tend to have lower biases all around, compared to lower middle and upper middle-income countries.
002: Infographic Design
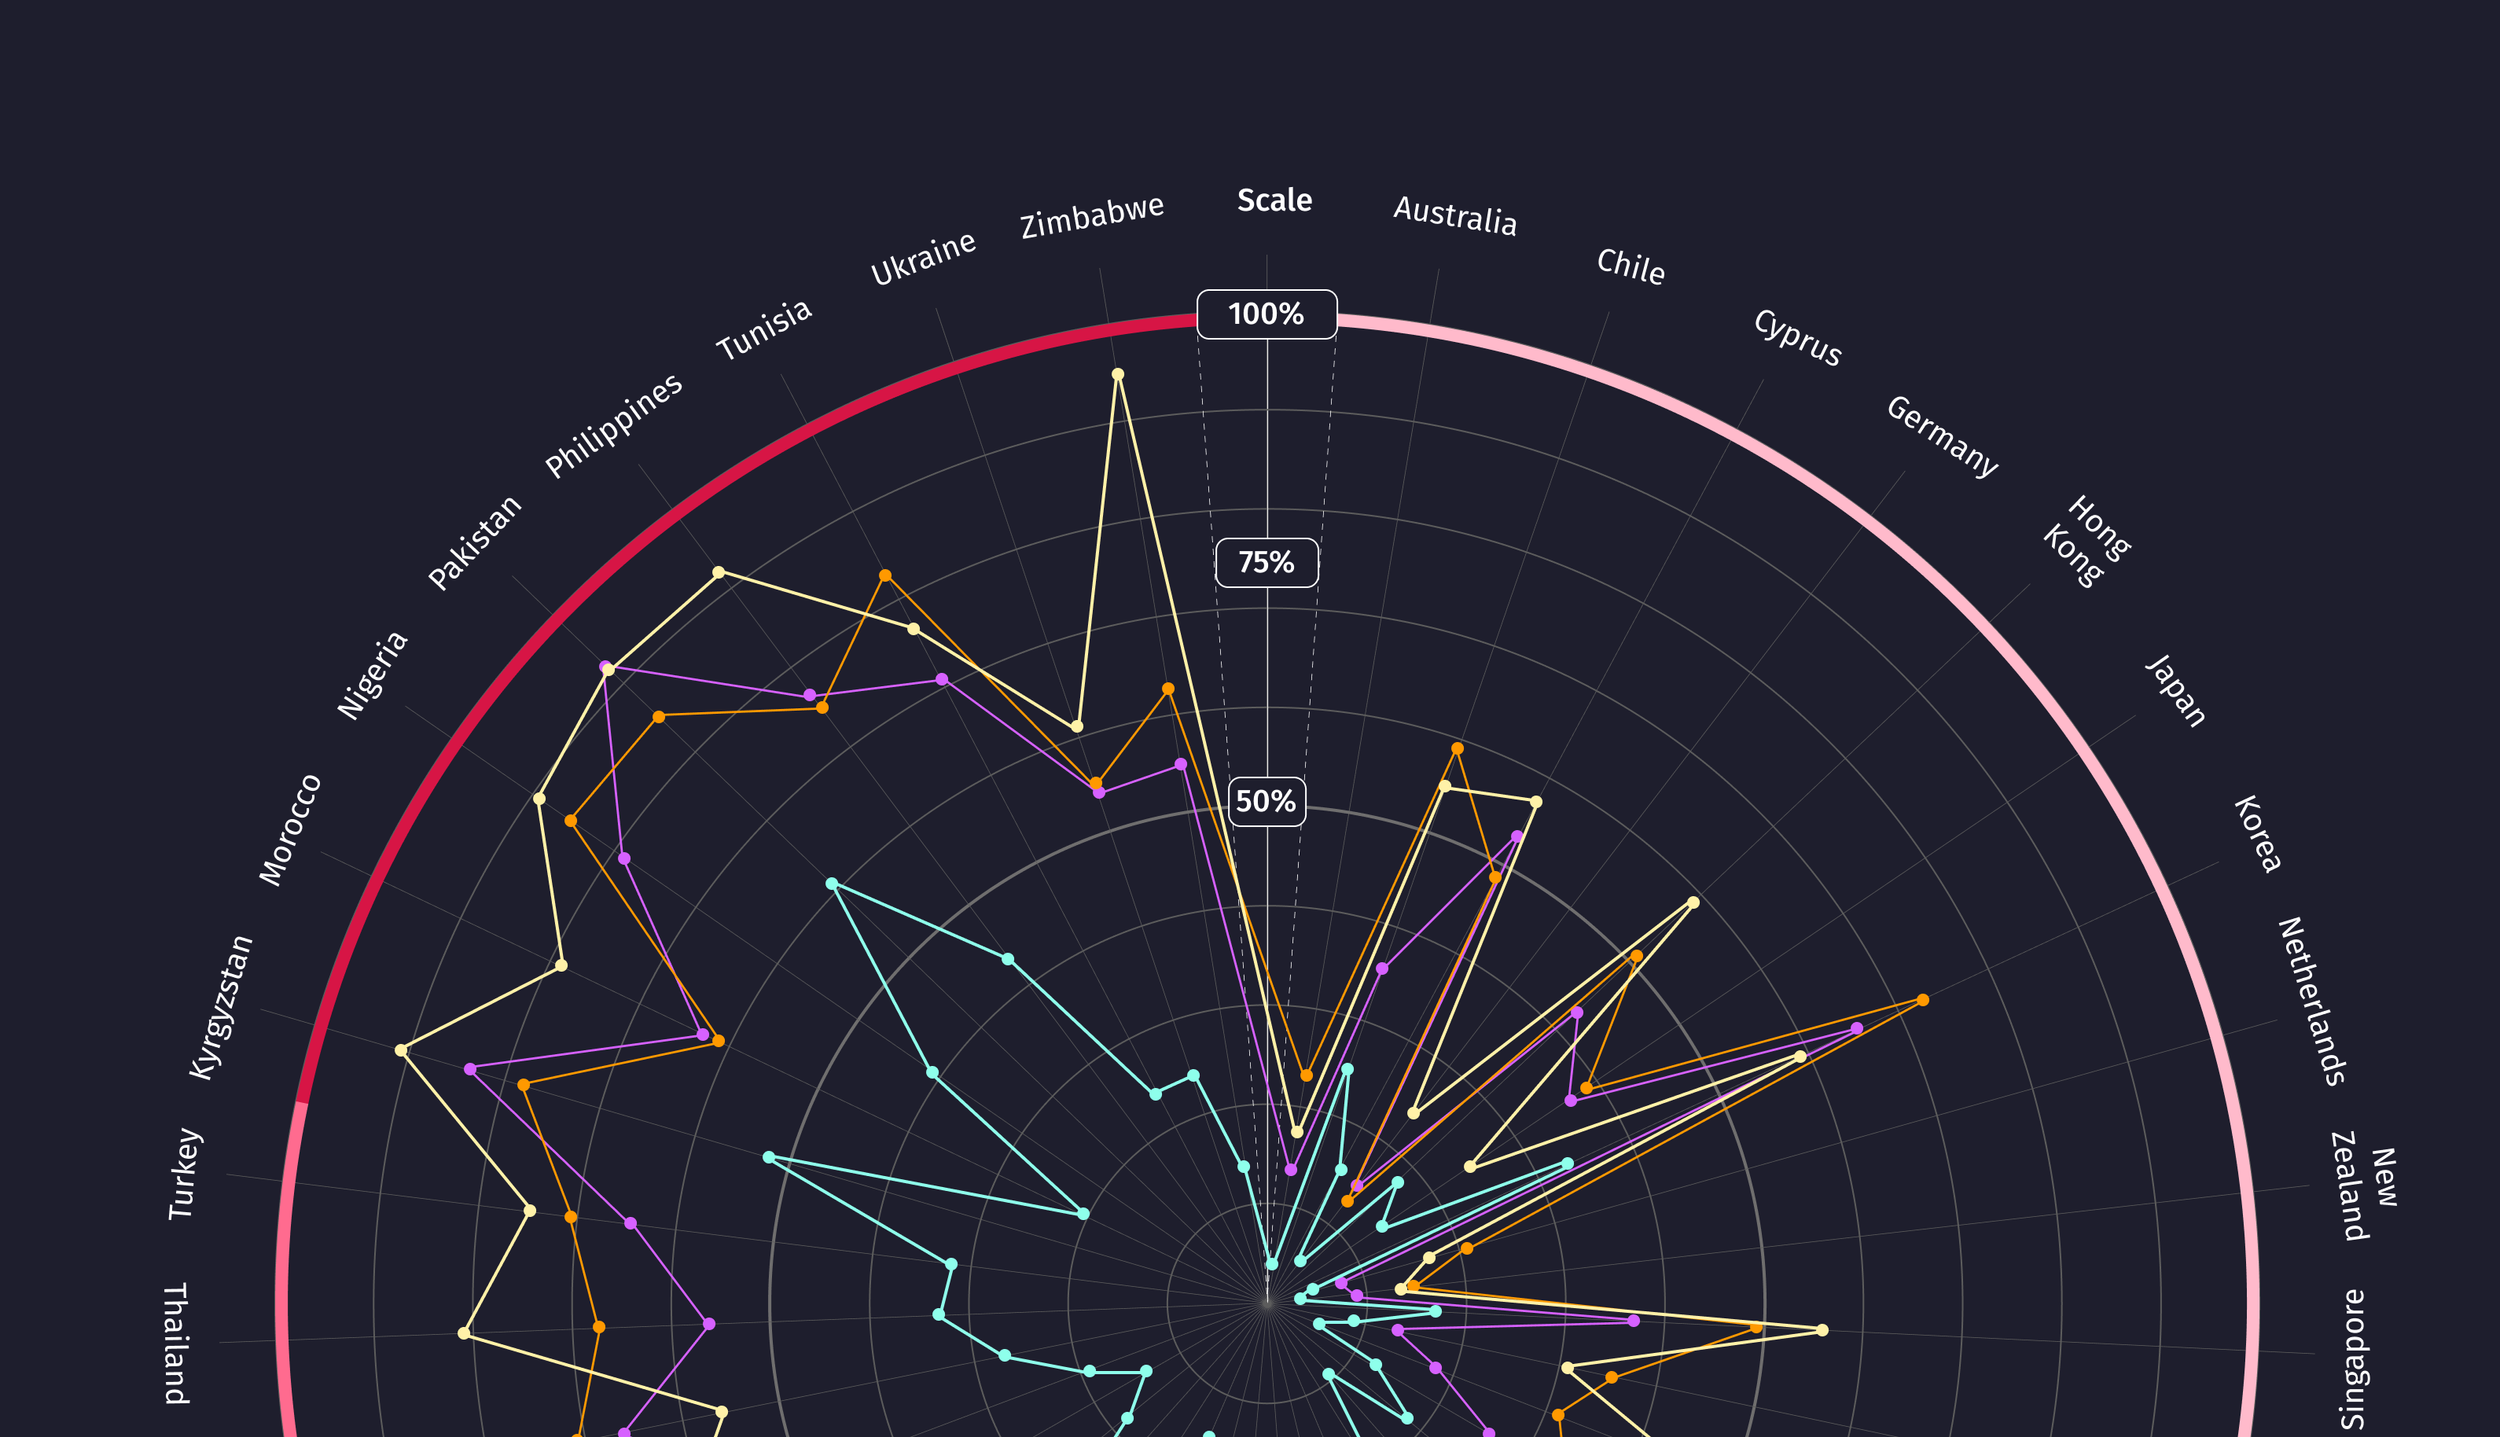
With these insights in mind, I decided to create a radial chart in Figma to visualize the dataset, as it would best allow me to compare gender biases across the different dimensions, and between countries with different levels of income.
For each country (along the perimeter of the radial chart), I plotted what the proportion of individuals who hold those biases are, in each dimension. Take a peek at the visualization below.
003: Design Process
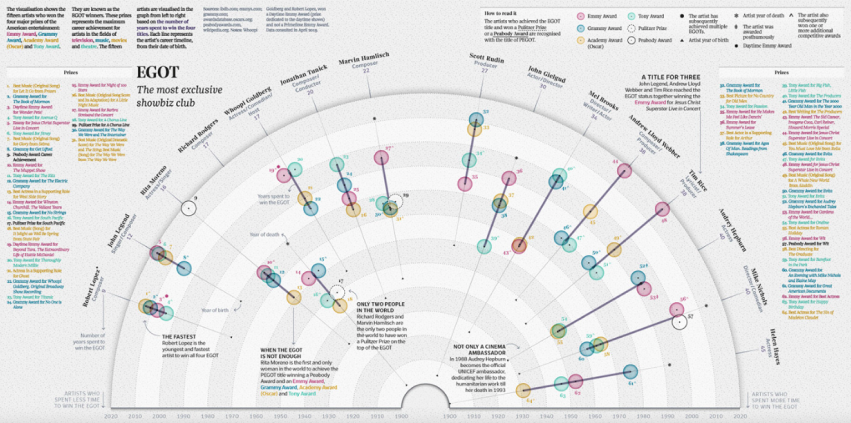
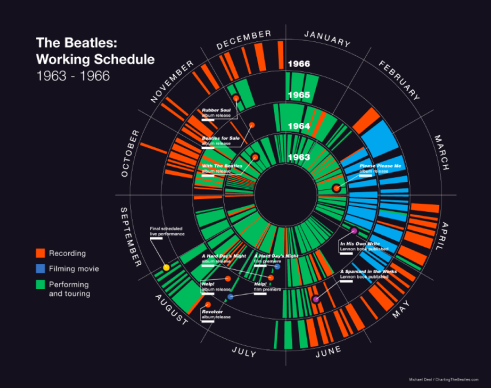
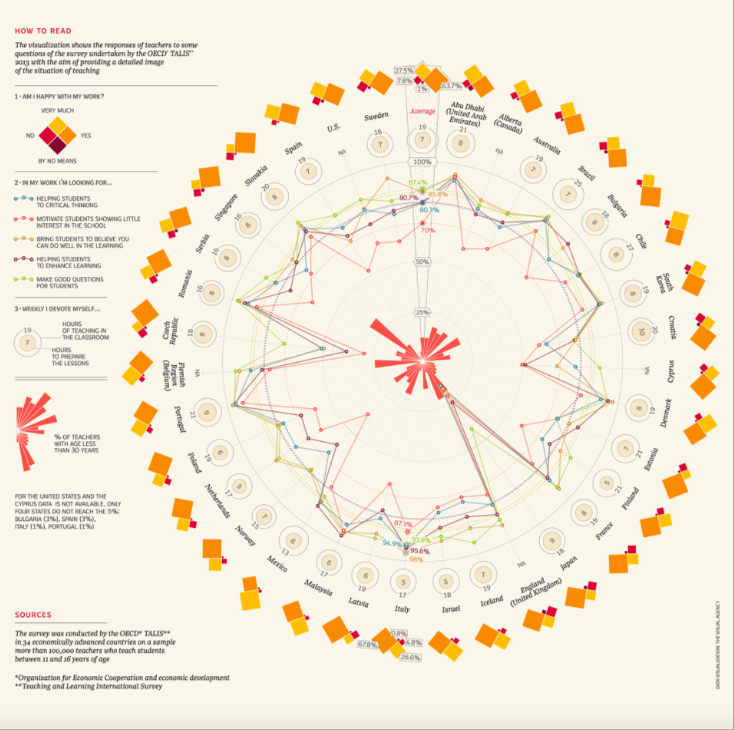
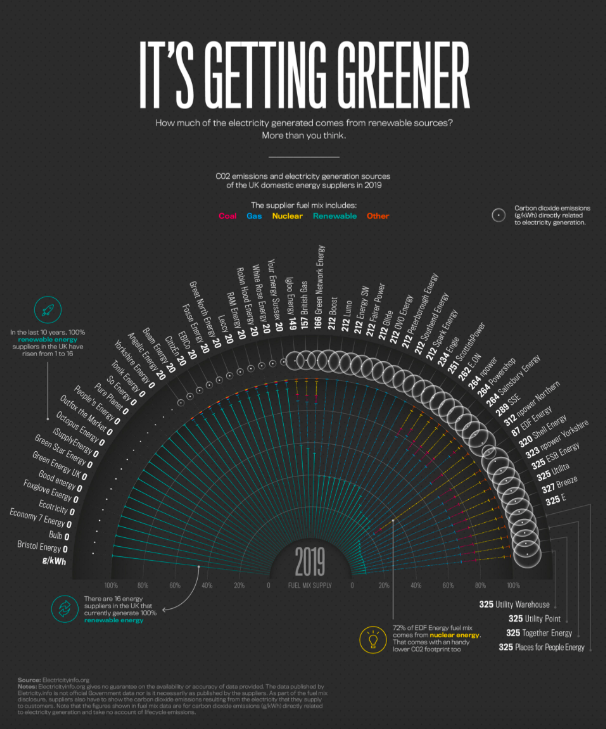
Inspiration moodboard
Once I decided that I wanted to visualize the data using radial charts, I started browsing online in LinkedIn and Reddit threads for inspiration from data experts and design leaders. Here are some of the stand-out charts that drew my attention and inspired the above work in style, composition - these were all part of my mood board as I started to create and iterate the infographic.
Layout and information hierarchy
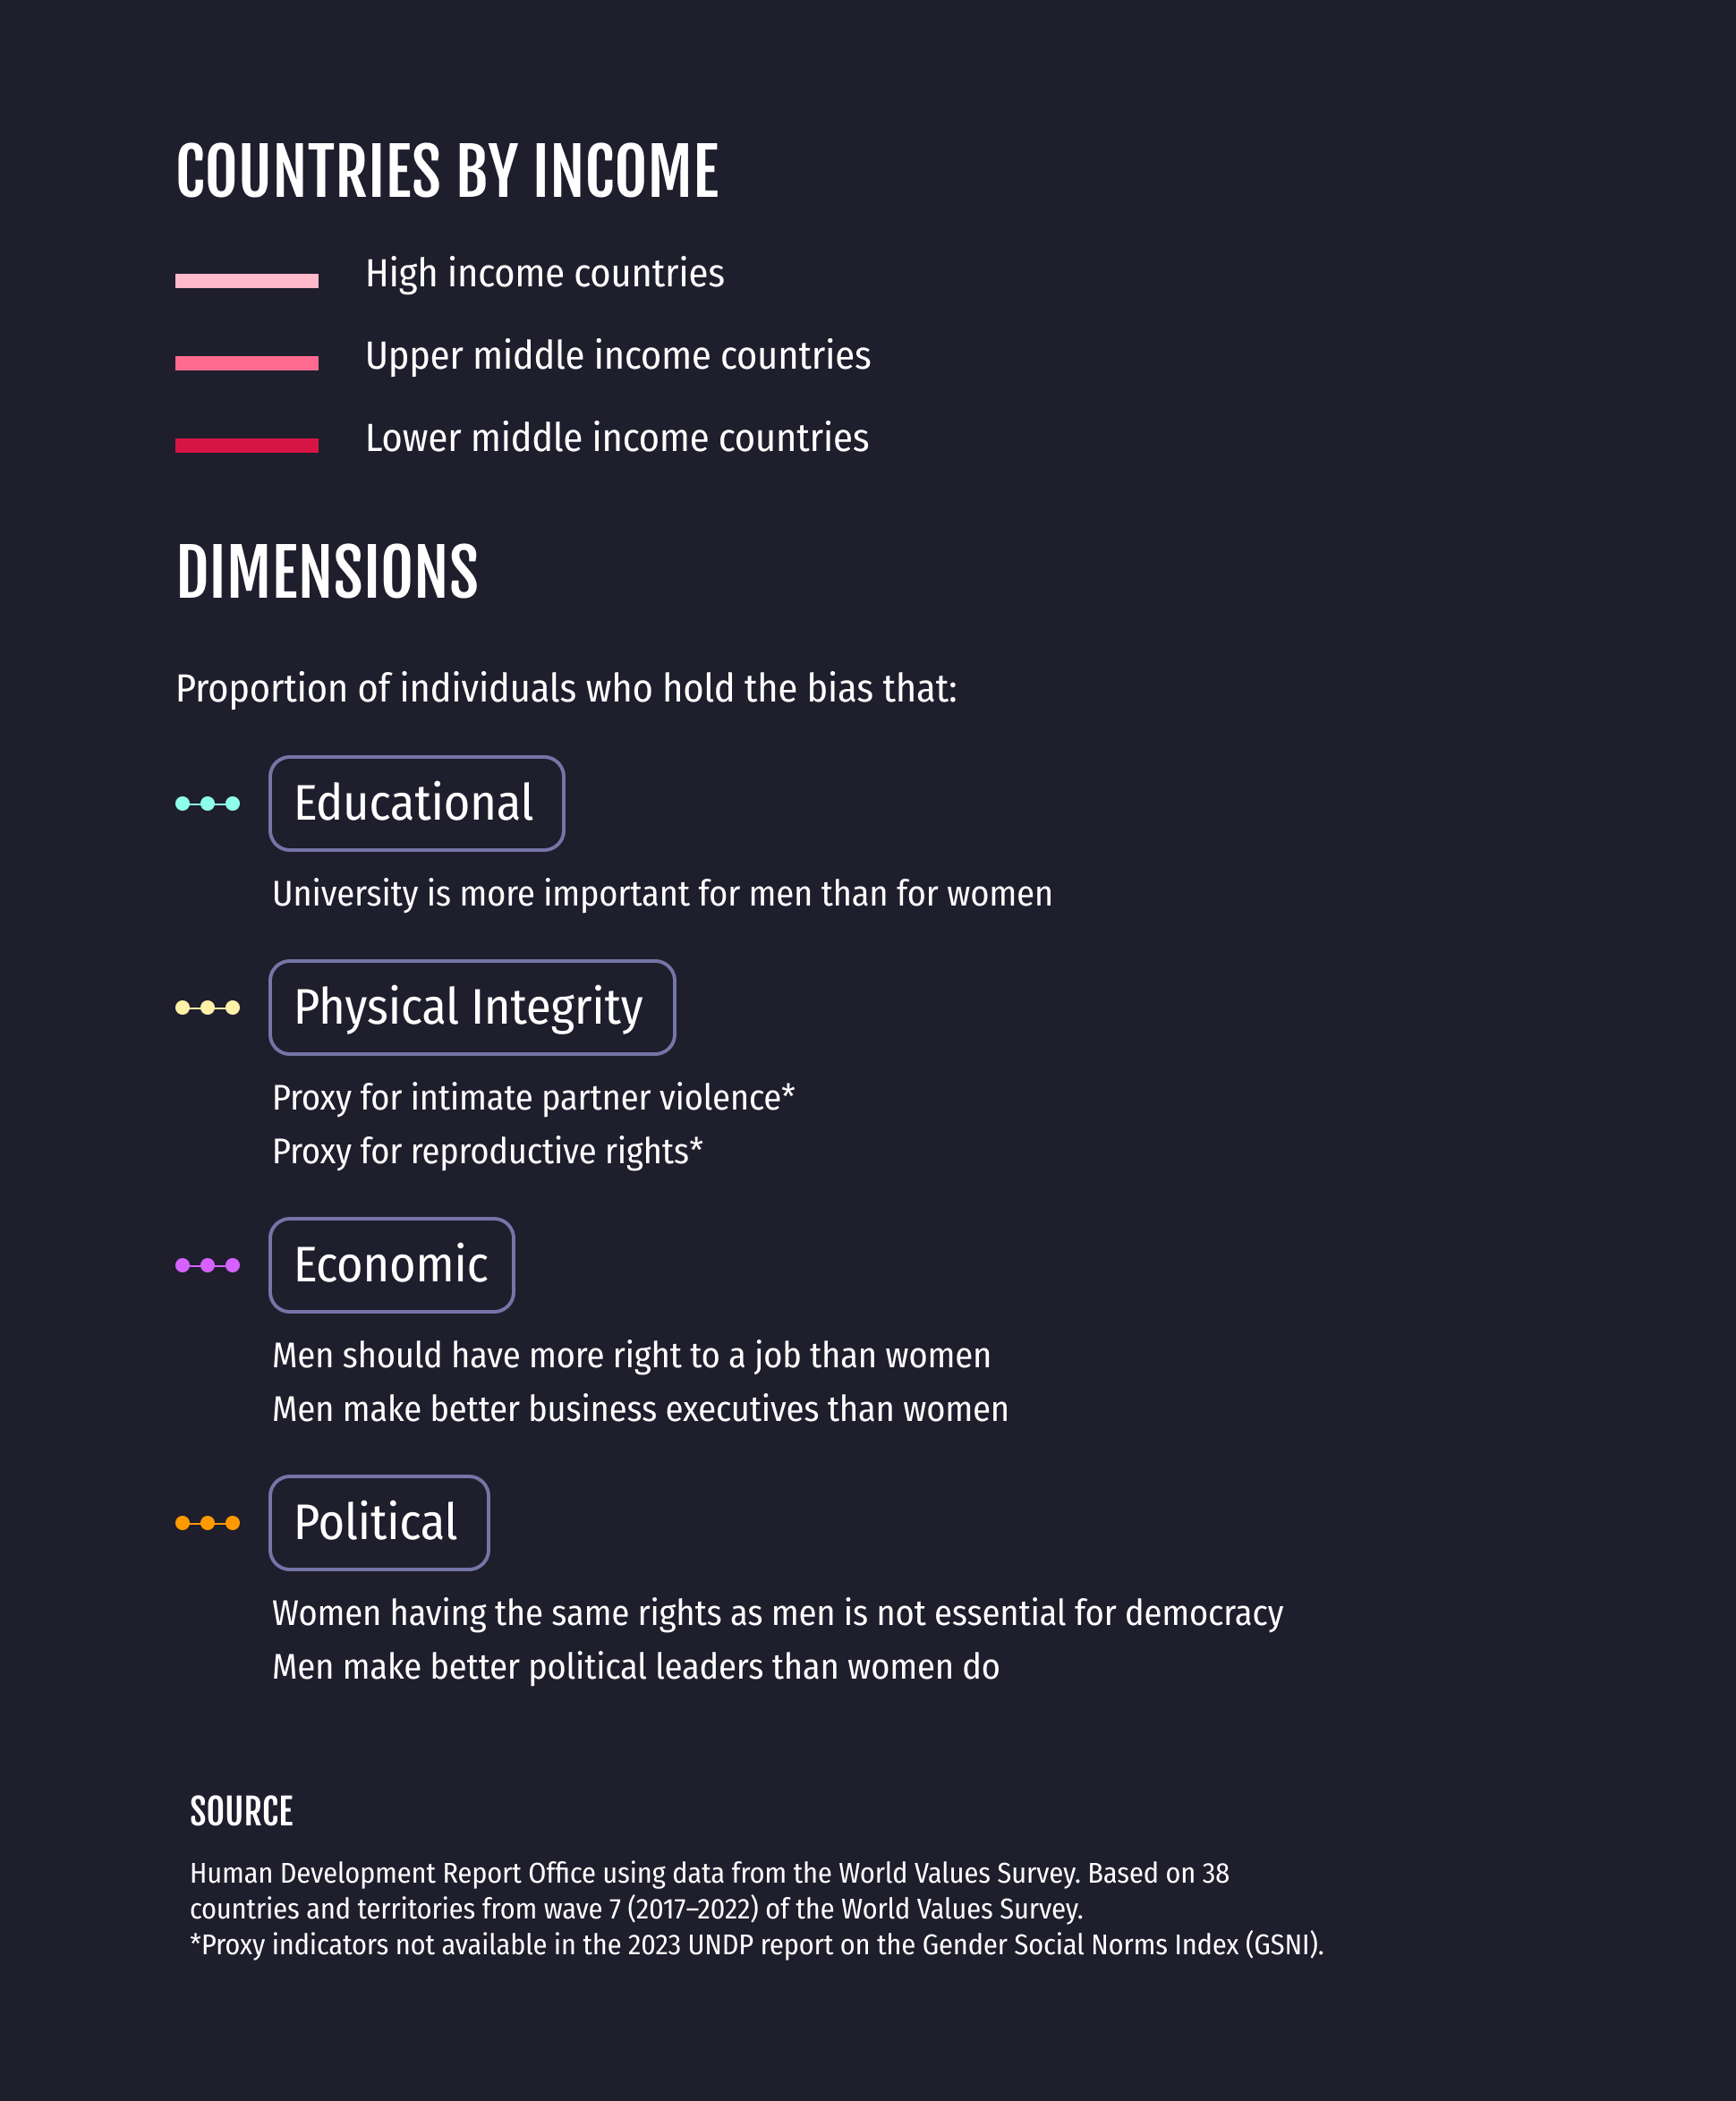
I wanted to make sure that the radial chart took up most of the space in the chart (~60-75%) as it included a large amount of small data points, which viewers might be interested in exploring in more detail. On the left-hand side of the visualization, I have also provided a brief overview of the data, as well as a legend for the countries by income, the dimensions, and associated indicators.
Colour scheme
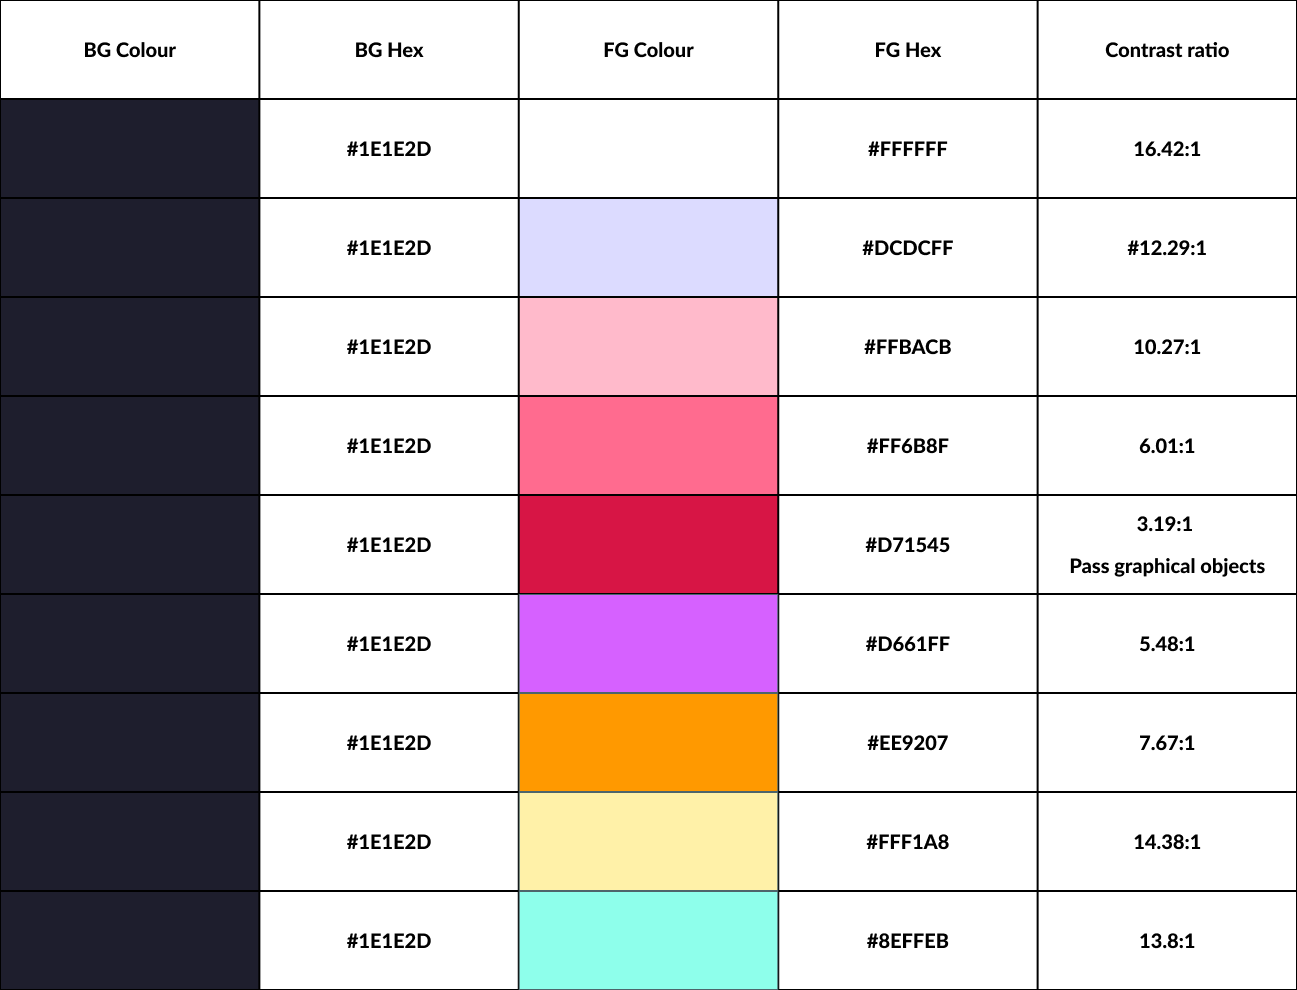
To emphasize the differences in the gender bias dimensions, I chose vibrant colours with the highest colour contrast ratios for the educational dimension (aquamarine blue, 13.8:1 contrast ratio) and the physical integrity dimension (bright yellow, 14.38:1 CR), so they stood out the most against the dark blue background. This is comparison to the political (orange, 7.67:1 CR) and economic dimensions (purple, 5.48:1 CR).
I created a contrast table with all the colours I planned to use and ensured that all colours passed WCAG 2.0 standards.
Interactivity
To enable users to explore each dimension in isolation when they access the chart in a digital environment, I added an interactive component. When a user clicks on a dimension, the other three unselected dimensions are greyed out, and the lines that make up each of the remaining three dimensions become thinner.